Network Monitoring is the continuous process of tracking the health, availability, and performance of network devices and links to ensure seamless connectivity and service delivery.
APM (Application Performance Monitoring) focuses on monitoring how applications perform from the user’s perspective, identifying slowdowns, errors, and bottlenecks across the application stack.
The platform described in your document integrates both into a unified monitoring ecosystem infrastructure, network, and application insights in one place.
Core Goals
- Ensure Availability – Detect outages or degradation early.
- Maintain Performance – Track metrics against baselines and SLAs.
- Optimize Capacity – Plan growth and avoid bottlenecks.
- Enhance User Experience – Identify and resolve slowdowns before users notice.
- Enable Proactive Management ,Use AI/ML to forecast issues and automate remediation.
Key Monitoring Domains
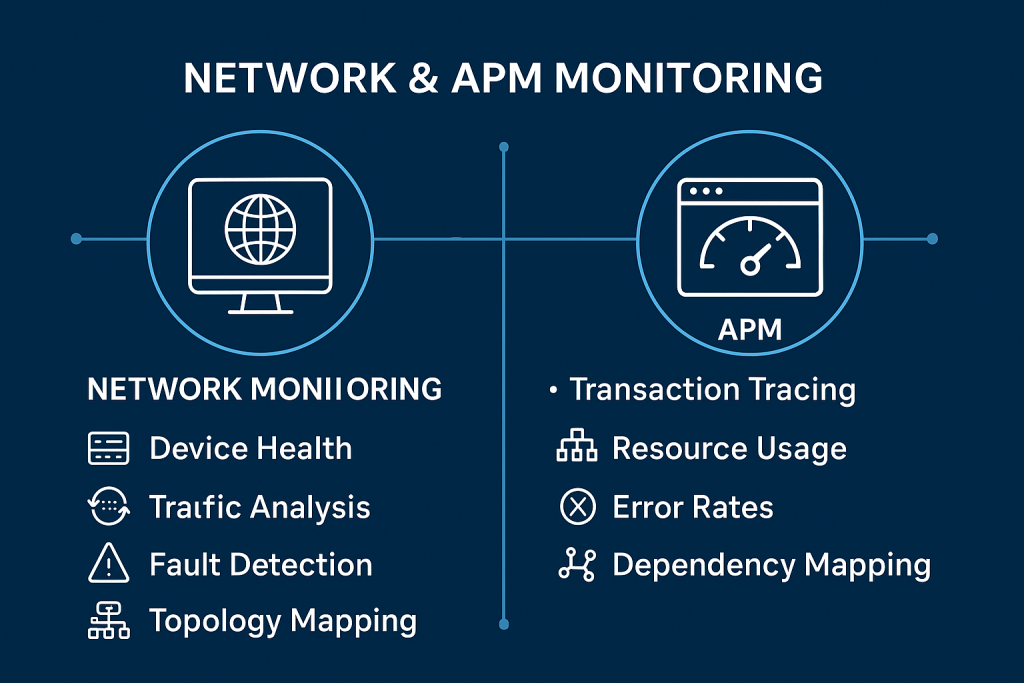
A. Network Monitoring
- Device Health – Switches, routers, firewalls, access points.
- Traffic & Flow – Bandwidth usage, top talkers, application-level flow analysis (NetFlow, sFlow, jFlow, IPFIX).
- Fault Management – Real-time alerts for critical, major, and warning events.
- Configuration Management (NCM) – Backup, restore, and audit network device configurations.
- Topology Mapping – Auto-discovery with visual maps for physical, virtual, and cloud networks.
- Security Awareness – Detect DDoS patterns and integrate threat feeds.
B. Application Performance Monitoring
- Transaction Tracing – Monitor user requests from front-end to back-end.
- Resource Monitoring – CPU, memory, disk usage for servers and VMs.
- URL & API Monitoring – Check response time and availability.
- Database Performance – Query time, connection health, threshold violations.
- User Experience – Synthetic and real user monitoring.
- Anomaly Detection & Forecasting – AI/ML-driven trend analysis to predict performance issues.
Common Metrics
- Network: Latency, packet loss, jitter, bandwidth utilization, error rate.
- Applications: Response time, throughput, error rates, Apdex score.
- Infrastructure: CPU/memory/disk usage, process availability, uptime/downtime.
Unified Benefits
- With a combined Network + APM platform like Motadata AIOps:
- Single Dashboard – One console for both network and application visibility.
- Correlated Insights – Link application performance drops to network issues.
- SLA Management – Measure availability & performance against contractual obligations.
- Runbook Automation – Automate fixes for known issues.
- Scalability – Support from small setups to 10,000+ devices.
Best Practice Features
- Role-Based Access Control – Secure multi-user access.
- Custom Dashboards & Reports – Tailored visualizations for different teams.
- Alerts & Notifications – Threshold-based, dynamic baselines, anomaly-based.
- Historical Analysis – Forensics, trend prediction, and capacity planning.Hybrid Monitoring – On-premise, cloud, and multi-site visibility.